Application performance Monitoring helps you monitor whether an app meets performance standards, identify bugs and potential issues, and provide flawless user experience via close monitoring of applications.
What do APM solutions measure?
- Observing whether your app behaves as it should.
- Collecting data on the source of the problem and alerting you of problems (app, app dependencies, or infrastructure).
- Modifying your application to fix problems before they have an heavy impact on your business
APM features on New Relic
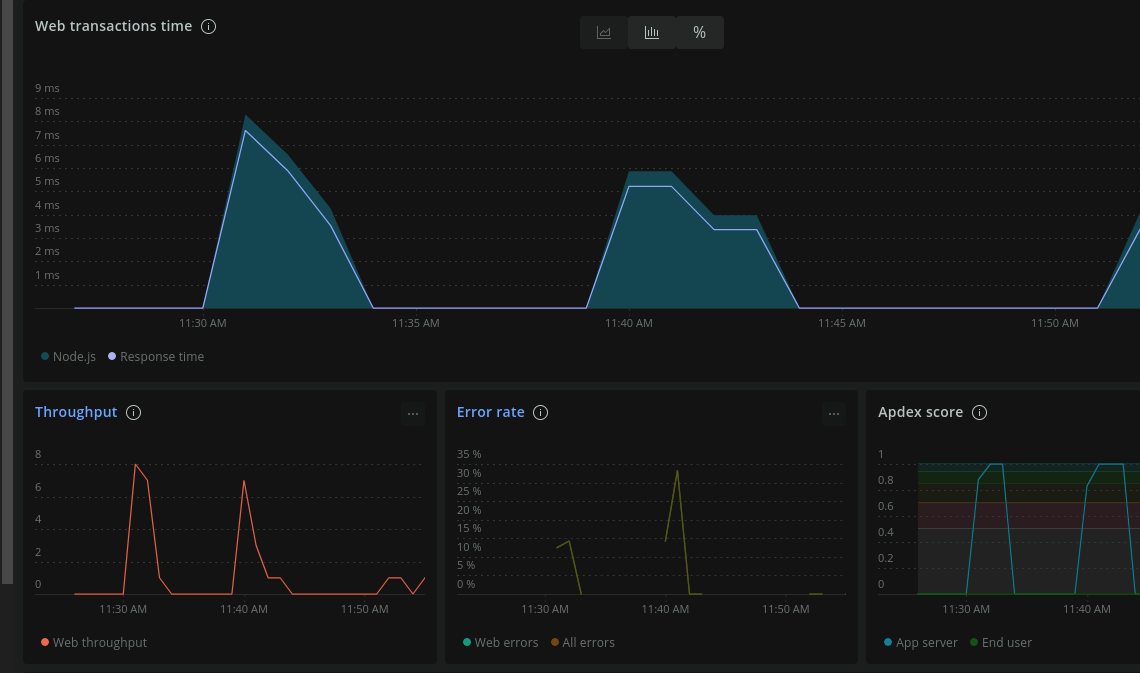
- App Performance
- Web transactions time: Average time it takes the service to process requests/transactions, broken down by process type. e.g database queries, queuing in the app server etc.
- Transaction traces: gives you information about which requests or transactions are the slowest.
- Throughput: Number of requests per minute this service processes.
- Error rate: ratio of errors to the number of requests this service processes I.e errors divided by transactions.
- Hosts: impact the processes have on CPU usage, memory etc..
- Apdex score: this gives user satisfaction from 0-1 based on response times for app servers and load times for end users. The more those times stay near your target thresholds, and the fewer errors you have, the higher your score. The closer your score is to 1, the better your app is performing.
- Distributed Tracing
This gives you visibility across distributed systems, showing you the path of a request as it travels between services. This is a valuable feature for large distributed systems that rely on many small services and microservices.
- APM and Infrastructure
Infrastructure accounts and APM accounts can be linked together and you will have access to them on the infrastructure UI pages(hosts, network, storage and processes).
- Logs
Logs can be correlated with other telemetry data, enable logs in context in New Relic. Logs adds metadata that links your logs with related APM data, like errors or distributed traces.
- Service Maps
This shows your apps connections and dependencies, including databases and external services. Health indicators and performance metrics show you the current operational status for every part of your architecture.
- Query your data
You can query and visualize your data.
- Sample and search APM transaction and error data.
- Browse your data visually with the data explorer.
- Create custom SQL-like queries of your data using the NRQL.
- Use dashboards to build advanced data visualizations, contextualize data, and understand what is going on in real time.
Collect data from any source
New Relic products report a lot of data. When you use products like APM, Browser, Mobile, infrastructure monitoring by default you receive performance data. Also you can bring data into New Relic that isn’t collected by default.
Install the Node.js agent.
- Create a New Relic account.
- Use the command npm install newrelic –save for each application you want to monitor.
- From node_modules/newrelic, copy newrelic.js into the root directory of your app.
- The agent can be configured via the newrelic.js file or via environment variable. You need to edit the license_key and app_name variables.
- Add require(“newrelic”); as the first line of your app’s main module.
- Generate some traffic, then wait a few minutes for data to appear in the APM UI
Add your Node.js application data (From APM UI)
- Give your application a name
- Install the agent (npm install newrelic –save)
- Download your custom configuration file and add it to your Node folder
- Add New Relic to your application’s main module (require(‘newrelic`);)
- Start your application
- Check for data